The Portuguese Tourism Market incurs in a great growth phenomenon with direct impact on demand and supply dynamics. Empirical studies show that one of the consequences of markets development growth maturation, results in implementation of new business optimization concepts and techniques such as implementation of Revenue Management practices.
Beginning a brand-new Revenue Management Implementation in Restaurant and Beverage Establishments (RBE's [1])
In this article we propose several general topics that have a great importance for RBEs when they intent to implement some revenue management processes.
Contrary to what is observed within accommodation in hotels or hostels, where the implementation of advanced revenue management techniques already exists, nowadays in RBE’s those practices are still not very expressive. This huge gap in RBEs is the cause of some concerns for the hospitality sector, where the dynamics of demand and supply are imperatives in an increasingly highly competitive market.
1. Specificities of RBEs
2. Structural pillars of Revenue Magement system in RBE's
3. Cost structure and accounting management (USAR [2])
4. Main performance indicators (KPI's [3]) of financial statements (P&L [4])
The Revenue Management model is based on the maximization of Revenue, using the knowledge we have about the customer and adding value to their experience with the correct sales timing.
The excellent results of its application in other businesses areas, such as hotel accommodation, aviation, travel agencies, tour operators, rent-a-car agencies, venues or events, prove the advantages of applying it to RBEs as well.
However, we can observe that these establishments have unique characteristics or specificities that can condition all their operation, from the perspective of revenue increase. We must always keep in mind the following characteristics to minimize the risk of implementation, only in this way we can take full advantage of the whole system and proceed with its correct workflow configuration.
1. Characteristics of Services and RBE's:
Intangibility - Services can’t be seen, tasted, heard, or smelled before being acquired because they are said to be intangible.
Expiry of service and perishability of your goods (raw supplies) - Services can’t be stored. When demand is stable there is a need for base supplies different from when it breaks out and can cause operational losses due to its perishability.
Heterogeneity - service inconsistencies (human factor and changes in demand), this is not uniform, with the same characteristics, varying from provider to provider. Services are highly dependent from his provider, as well as they are delivered, it’s a highly variable game. It’s imperative to invest in human resources quality processes to ensure customer satisfaction. Services can be composed by other general services increasing the value for customer with a "service package".
Simultaneity and Inseparability - Services are produced and consumed simultaneously, which is not the case with products, they are produced, stored, distributed and consumed later. The interaction with customers is a constant, being one of the most relevant characteristics in services, both are part of the process and influence directly result.
Rigidity of Supply - Services must be provided in a controlled environment, usually an establishment that has a fixed number of seats (limited and fixed capacity) and cannot be transported to another place or region (space). The time for providing the service is limited according to the predefined service standards.
Complementarity - A service can be combined with several other "accessory" services, but complementary to each other. For example, in the RBE's we can have other services to complement the experience of the visitor (ex: entertainment shows, music, workshops, etc ...)
We can say with certainty that the characteristics of the services depend on intangible elements to proceed with the creation of value, so their evaluation becomes subjective and variable from client to client. For organizations, the relentless pursuit of the relative excellence of services and the measurement of the intrinsic quality have become strategies for obtaining a competitive advantage based on some models of quality assessment (which will be addressed in another article in more detail) and are essential in RBE's revenue management models.
2. Structural pillars in the Revenue Management system in RBE's
The Revenue Management System multiple areas where it is applied, derive from the practice of price oscillation according to the demand, this practice was denominated yield management. It uses statistical and mathematical tools applied to the prior goal of revenue maximization for the global company benefit. Over time, this concept has evolved adopting a new designation "Revenue Management" that is constantly changing and is currently much more holistic affecting multiple business departments. In RBE's we can say that an RM system is based on the following structuring pillars of revenue increase and management.
- Business Analysis and diagnosis for Revenue Management system implementation
- Business concept and USP (unique selling proposition)
- Demand Stimulation
- Forecasting
- Booking management – no-shows, cancellations and overbooking management.
- Sales pricing and targeting management
- Restaurant menu management
- Groups management in RBE's - Menu with fixed price
- Inventory planning and availability management - total capacity, turnover and meal times (seats)
- Active promo and actions at the point of sale - upselling and suggestive selling
- Distribution and channels management
- Quality management
- Guest feedback and reputation management
- Control and evaluation of RM efforts
We will analyse and develop in future articles each one of these pillars of revenues increase on RBE's, already used in several business units.
This systems and revenue management processes can be complex, depending from the type of establishment that we have or from the available resources. That’s because of this lack of knowledge and resources that many establishments prefer hiring externally a specialized team (outsourcing), to manage the whole process of implementation and business follow-up.
3. Cost structure and management accounting (USAR)
This whole system must be tuned with our accounting system and internal information for the management of the unit, otherwise all this produced data wouldn’t make any sense and is useless for revenue optimization.
In the image below, we can find a proposal for an operating income statement (summary) that will be the basis for all revenue management and optimization work. In this general proposal some reference relative values can be found for a small or medium-sized unit, although these values tend to vary significantly depending on the type of establishment we have, however, they serve as a reference and it’s our starting point for a good business development.
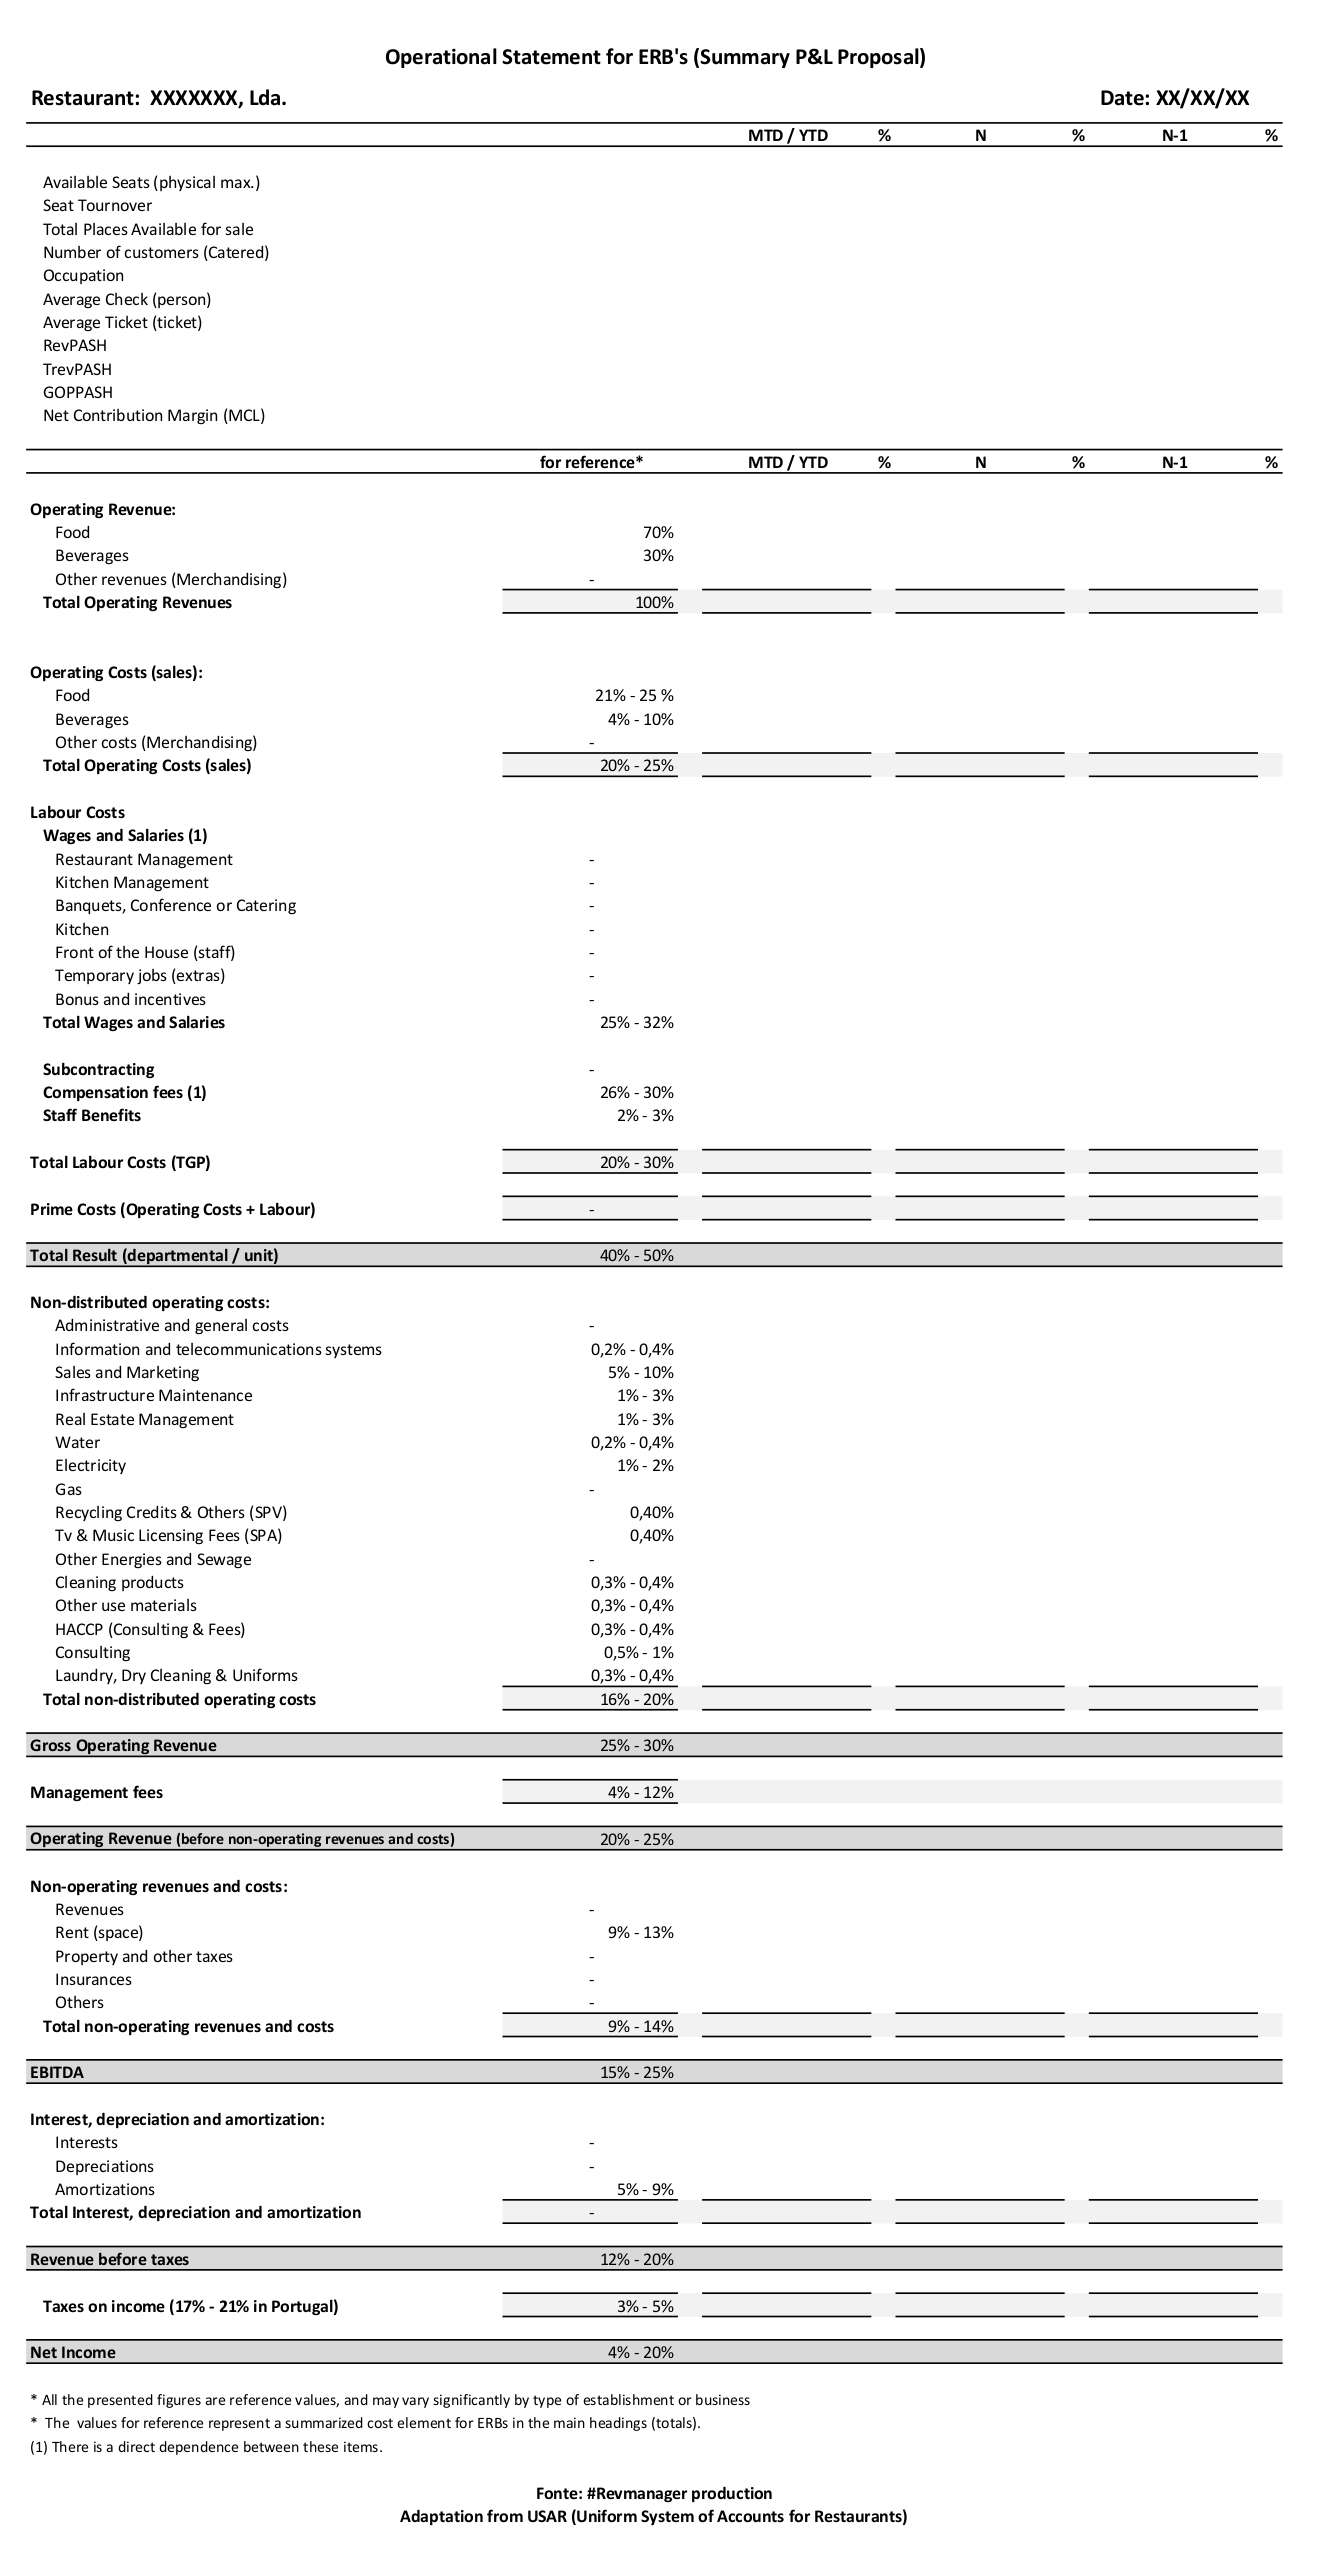
From this P&L statement, we will be able to calculate and work on some key performance indicators that will indicate company success. This Kpi’s serve almost as a road sign on a dangerous road with many curves, setting what we are doing well and where we need to improve. Those statements, when properly configured in our accounting information systems (ERP), tend to be easy to consult and very useful to establishments business management.
4. Key performance indicators (KPIs)
There are other indicators that will be explored in the future, however the criteria for choosing these have to do with their functionality and readability through this P&L statement (USAR), facilitating the start of the entire process of implementation of a functional revenue management system for producing useful and real-time information.
One of the main goals of this initial analysis will be to verify if all unit in question is properly balanced or if needs some hard corrections. This will be the beginning of a path guided by the change of old habits and implementation of new procedures that increase the probability of high results.
- Seat Turnover (seating places)
$$Seat Turnover = \frac{\text{Number of customers (Catered)}} {\text{Available places}}$$
- Cost of food sales (CSfood)
$$CSfood ={\text{Initial Inventory + Purchases – Ending Inventory}}$$
- Cost of beverages sales (CSbeverage)
$$CSbeverage ={\text{Initial Inventory + Purchases – Ending Inventory}}$$
- Food Cost (Food Cost %)
$$Food Cost = \frac{\text{Cost Food Sales (€)}}{\text{Food Revenue (€)}}* 100$$
- Beverage Cost %
$$Beverage Cost = \frac{\text{Cost of Beverage Sales (€)}}{\text{Beverage Revenue (€)}}* 100$$
- Cost of Goods Sold (COGS [5])
$$ COGS = {\text{Beverage Cost (€) + Food Cost (€)}}$$
- Prime Cost (Cprime)
$$ Cprime ={\text{Cost of Goods Sold (COGS) + Labor expenses}}$$
- Average Check (Ckperson)
$$ CKperson = \frac{\text{Food and Beverage Revenues (€)}}{\text{Total Number of Guests Served}}$$
- Average Ticket (Atticket)
$$ ATticket = \frac{\text{Food and Beverage Revenues (€)}}{\text{Total Number of Tickets}}$$
- Revenue per available seat hour (RevPASH)
$$ RevPASH = \frac{\text{Total Revenue F & B (€)}}{\text{restaurant seats x work hours}}$$
- Total Revenue per available seat hour (TRevPASH)
$$ TRevPASH = \frac{\text{Total revenue (F & B) + other merchandising}}{\text{restaurant seats x work hours}}$$
- Gross operating profit per available seat hour (GOPPASH)
$$GOPPASH = \frac{\text{Total Revenue - Operating Costs}}{\text{restaurant seats x work hours}}$$
- Net Contribution Margin (MCL %)
$$ MCL = \frac{\text{Net Result}}{\text{Revenues}}* 100$$
Many other indicators could be presented considering the complexity of RBEs management, such as the CashFlow indicator, RevPASQM [6] (most commonly used in conference and event organizers) or customer loyalty rate. However, as these indicators are not directly mirrored in the present P&L statement, we intent to present them at a future opportunity in specific BSC (Balanced Scorecard) models. The performance indicators presented allow a quick and comprehensive diagnosis of the entire company operation beginning the process of Revenue Management (RM) system implementation.
Authors:
This article was written in coautorship by Soraia Mourinho and Miguel Costa


